An interactive 3D plot#
Interactive plot of the Copalis Beach topography#
The script $GTT/topo/pyvista_CopalisTopo.py was used to create a 3D view of
the Copalis Beach topography as described in 3D plots using PyVista.
Here is an interactive version created by setting output = 'html' in the
script and then embedding the resulting html file in this page:
Changing sea level / coastal subsidence#
The script pyvista_CopalisTopo_sealevel.py can be run to open an
interactive view that allows you to change sea level, in order to explore
what this topography would look like if sea level rises (or following the
co-seismic subsidence of an earthquake).
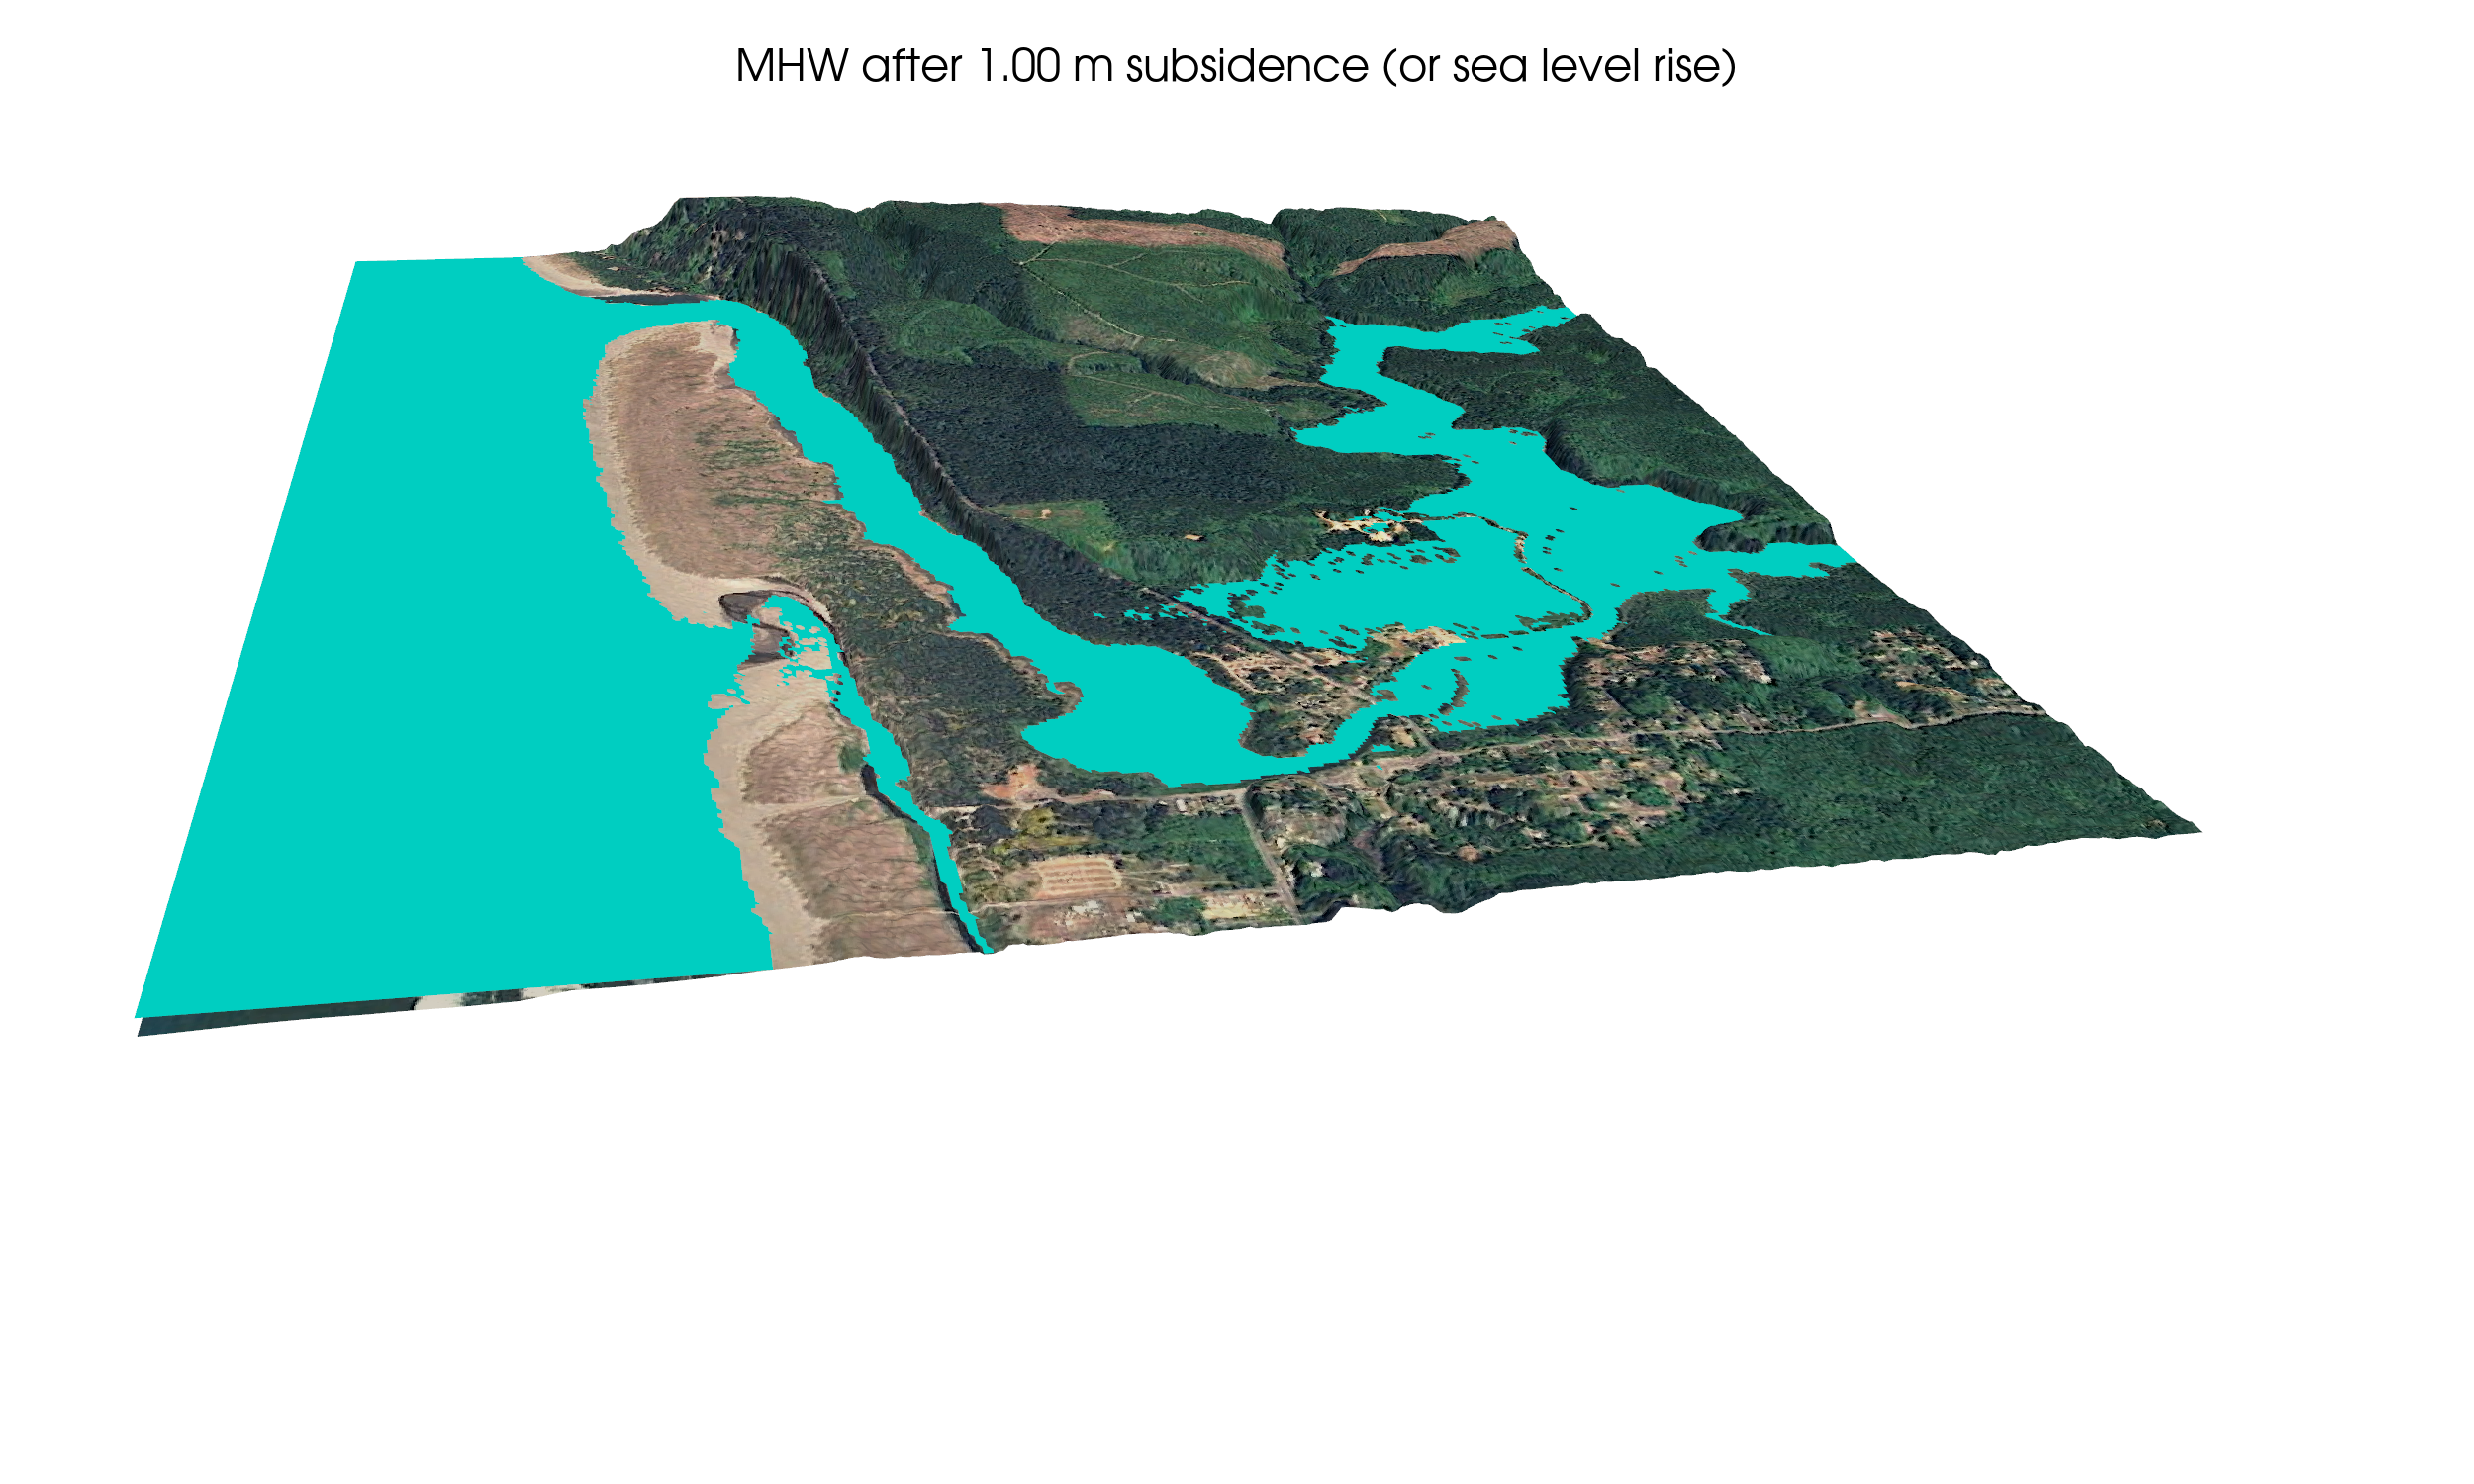
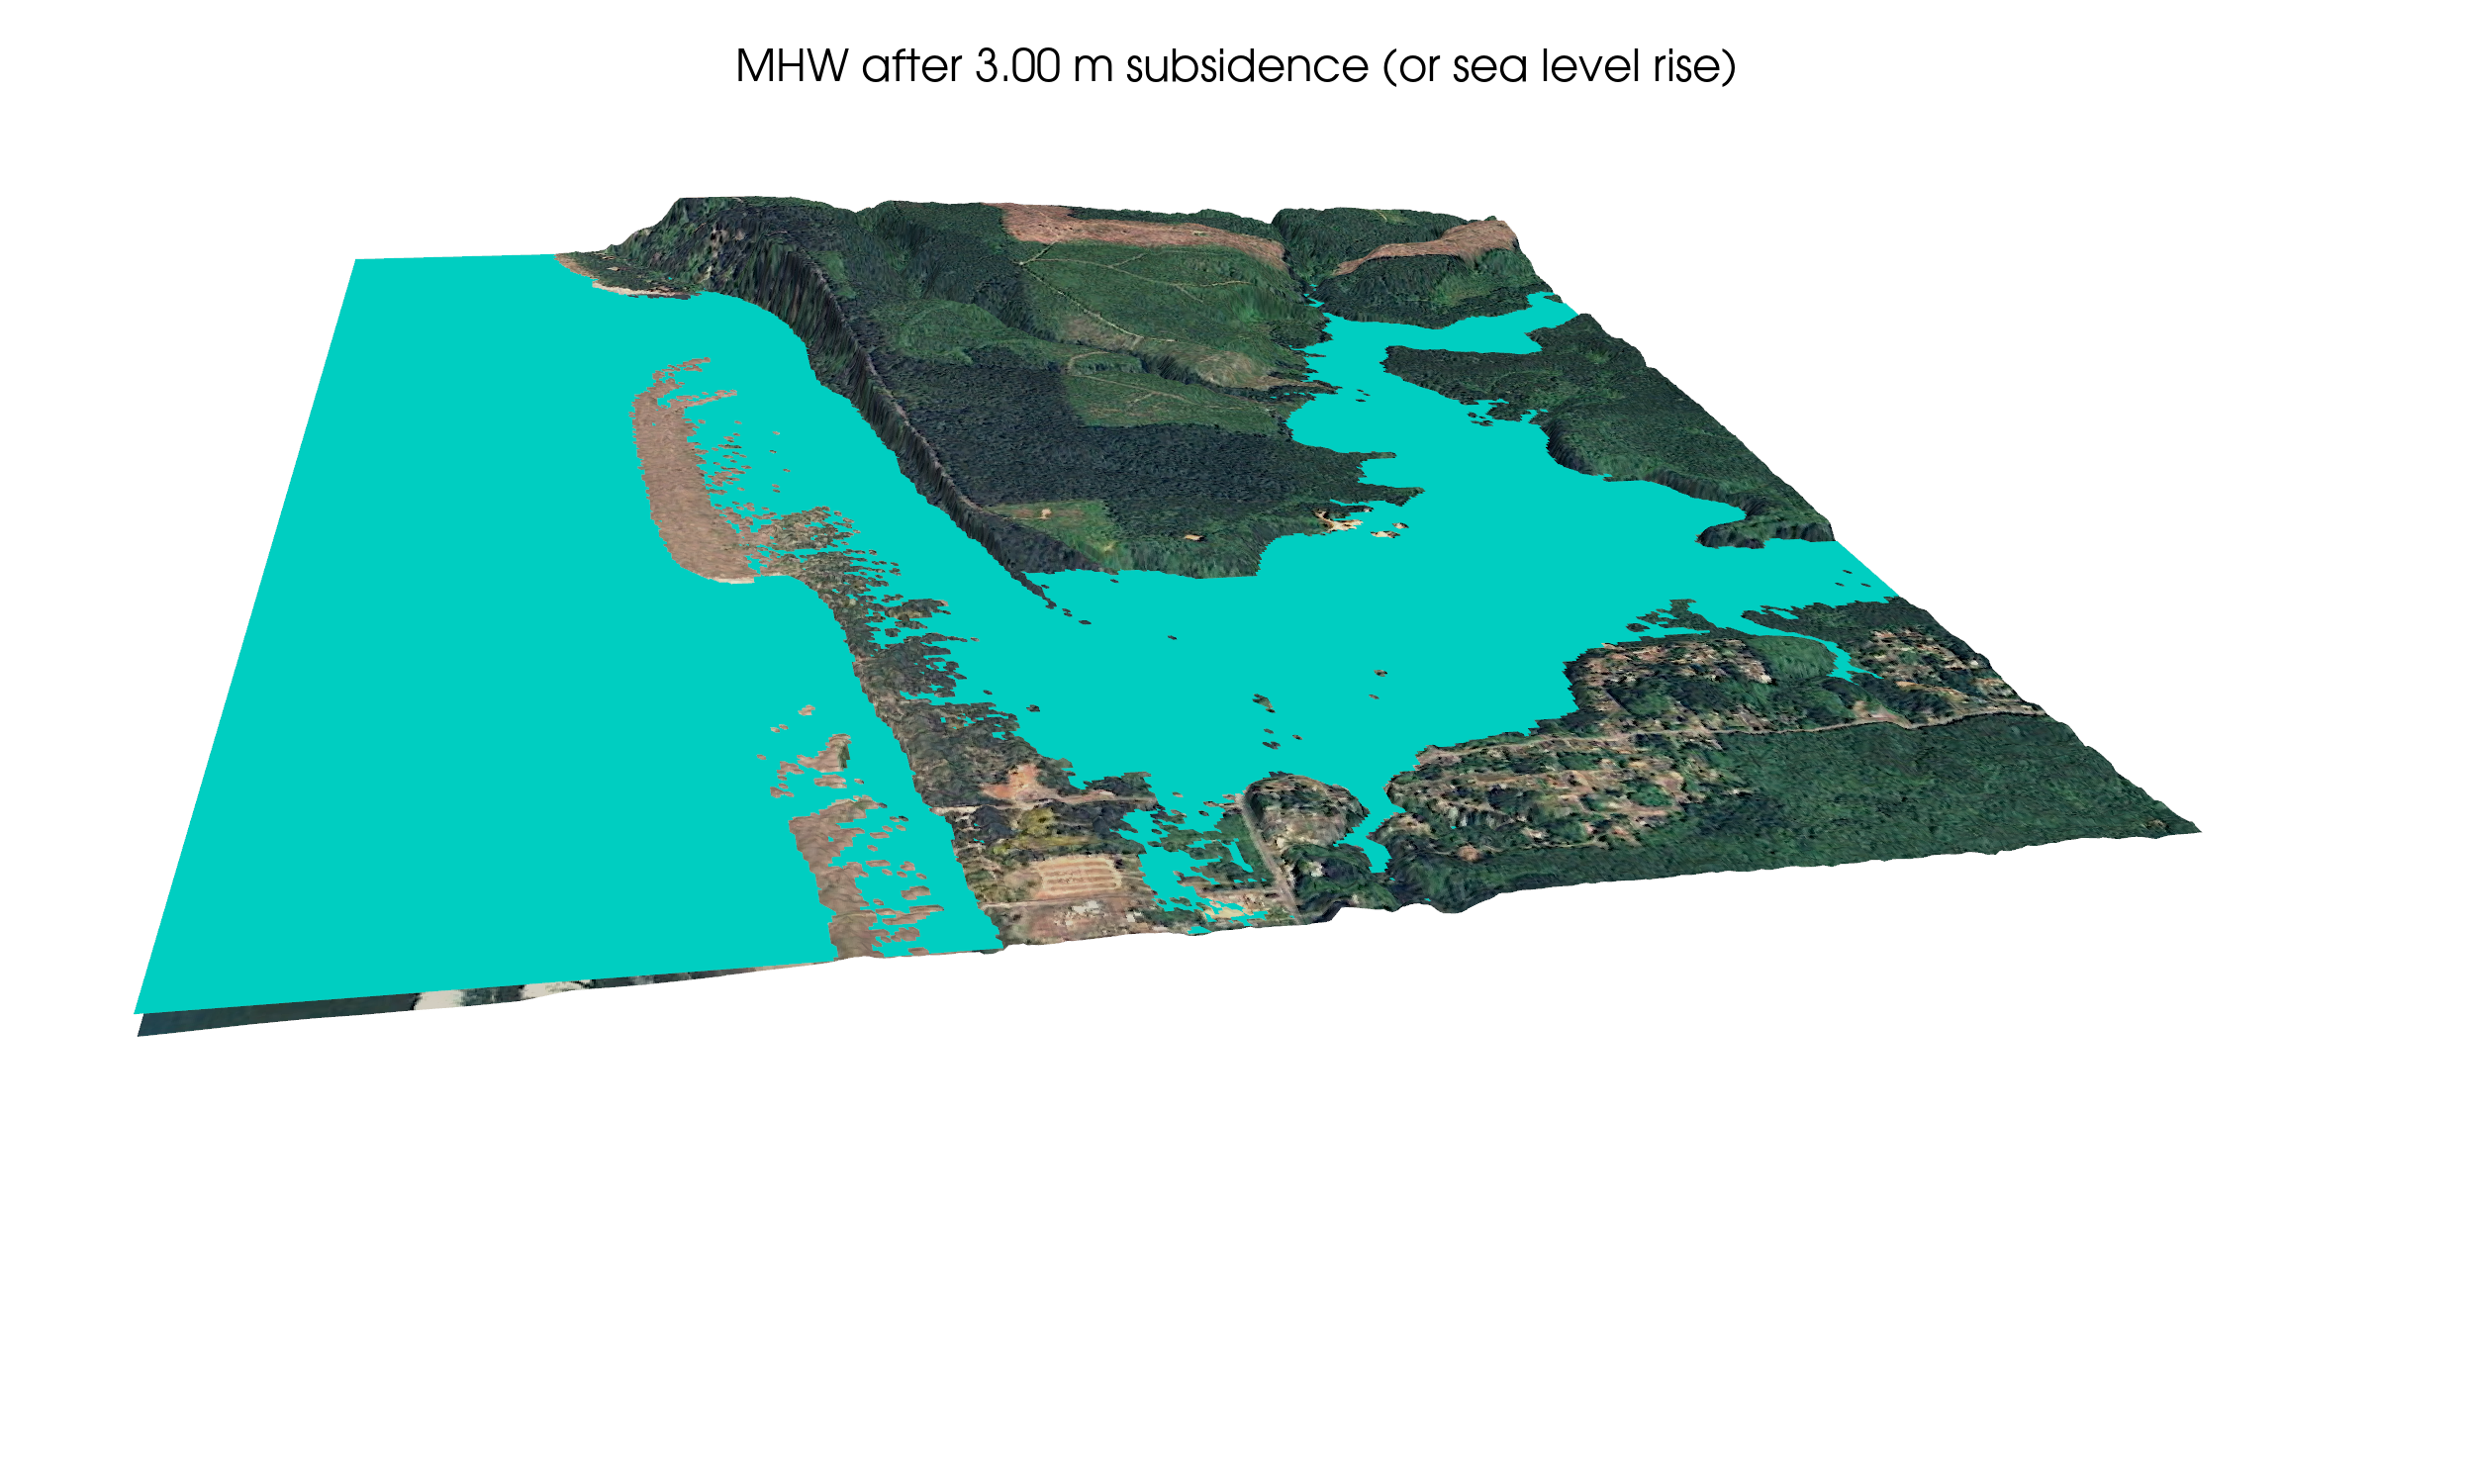
Below are a couple of snapshots that were produced by setting
make_snapshots = True in the script.
The water surface at the current MHW is shown in plots above. These snapshots show two elevated levels.