
Download etopo22 topography#
This Jupyter notebook is available in $GTT/topo/fetch_etopo22.ipynb within the
GeoClaw Tsunami Tutorial.
It creates the file $GTT/topo/topofiles/etopo22_30s_-130_-122_40_50_30sec.asc, which can be used as a topofile in GeoClaw. The resolution is 30 arcsecond.
The etopo22 dataset is described on the webpage ETOPO 2022 15 Arc-Second Global Relief Model.
Note that there is also a 15 arcsecond database, but it is split up into tiles and so it’s a bit harder to download an arbitrary subset by the approach used here, and you may have to download pieces and stitch them together.
For most purposes 30” topography is more than adequate in the ocean, since in GeoClaw the topofile used for the deep ocean is usually augmented by one or more coastal DEMs at much higher resolution.
Note: This topofile can alternatively be downloaded using the $GTT/topo/fetch_topo1.py script.
%matplotlib inline
from pylab import *
import os
from clawpack.geoclaw import topotools
Set the limits of the domain and resolution desired:
extent = [-130, -122, 40, 50]
coarsen = 1
arcsec = coarsen * 30
print('Will download etopo22_30s data at %i arcsecond resolution' % arcsec)
Will download etopo22_30s data at 30 arcsecond resolution
url_thredds = 'https://www.ngdc.noaa.gov/thredds/dodsC/global/ETOPO2022/30s/30s_bed_elev_netcdf/ETOPO_2022_v1_30s_N90W180_bed.nc'
topo = topotools.read_netcdf(url_thredds, extent=extent,
                             coarsen=coarsen, verbose=True)
Will read netCDF data from
    https://www.ngdc.noaa.gov/thredds/dodsC/global/ETOPO2022/30s/30s_bed_elev_netcdf/ETOPO_2022_v1_30s_N90W180_bed.nc
Returning a DEM with shape = (1200, 960)
x ranges from -129.99583 to -122.00417 with dx = 0.00833333
y ranges from 40.00417 to 49.99583 with dy = 0.00833333
name = 'etopo22_30s_%s_%s_%s_%s_%ssec' % tuple(extent + [arcsec])
fname = 'topofiles/%s.asc' % name
topo.write(fname, topo_type=3, header_style='asc',
           grid_registration='llcorner', Z_format='%.0f')
print('Created ',fname)
Created topofiles/etopo22_30s_-130_-122_40_50_30sec.asc
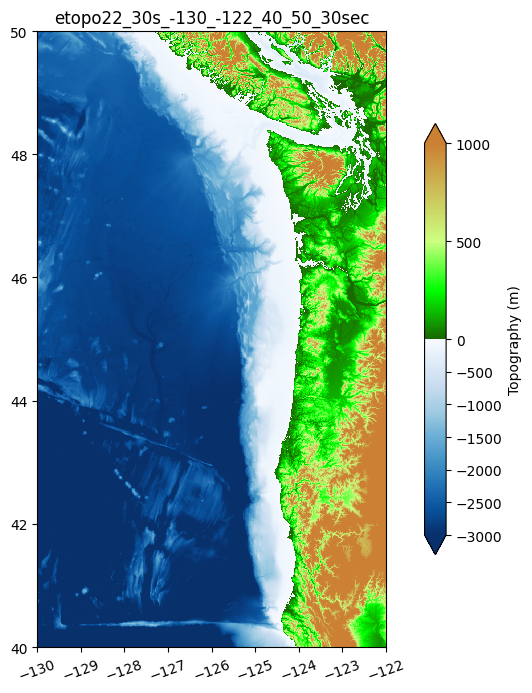
Make a plot#
figure(figsize=(10,8))
ax = axes()
topo.plot(axes=ax, limits=(-3000,1000),
          cb_kwargs={'extend':'both','shrink':0.7})
title(name)
fname = fname.replace('.asc', '.png')
savefig(fname)
print('Created ', fname)
Created topofiles/etopo22_30s_-130_-122_40_50_30sec.png
Make a file containing the shoreline#
This is only done so that the shoreline can be read in and plotted in other notebooks, e.g. Make ASCE_SIFT_Region2 dtopo file. This saves the shoreline as a collection of piecewise linear segments, with x and y values in csz_shore[:,0] and csz_shore[:,1] respectively.
csz_shore = topo.make_shoreline_xy()
fname = 'topofiles/csz_shore.txt'
savetxt(fname, csz_shore)
print('saved csz_shore from etopo1 in ',fname)
saved csz_shore from etopo1 in topofiles/csz_shore.txt