
CopalisBeach examples#
From the GeoClaw Tsunami Tutorial
The directory $GTT/CopalisBeach
contains some example simulations of tsunamis inundating the coastal region
around Copalis Beach, WA (-124.1733, 47.1134)
Contents#
Copalis Beach example1: Some sample runs, illustrating different grid resolutions.
Sample results for example1: Comparison of results.
Setting up the GeoClaw run: Annotated description of
setrun.pyGauge plots for example1: Some tips on interpreting time series produced at synthetic gauges.
Copalis Beach exercise1: An example to try running yourself, with some suggested modifications.
Running/debugging the Copalis exercise1 code: Instructions and tips for getting it running.
Setting up the time frame plots: Annotated description of
setplot.py
Copalis Beach example2: An example that produces output on fgout and fgmax grids.
Plot fgmax results: How to read in and plot the fgmax results.
More to come.
Input files#
The examples use some topofiles and a dtopofile that can be downloaded from an online data repository in order to quickly get into the GeoClaw simulation examples:
$ cd $GTT/CopalisBeach
$ python fetch_input_data.py
Alternatively, you can run the notebooks listed below, found in the $GTT/topo and
$GTT/dtopo directories, which were used to create the files:
Download etopo22 topography, which creates
$GTT/topo/topofiles/etopo22_30s_-130_-122_40_50_30sec.ascwith 15 arcsecond resolution, covering full domain.Make topofiles for Copalis Beach, which creates
$GTT/topo/topofiles/Copalis_13s.ascwith 1/3 arcsecond resolution.Make ASCE_SIFT_Region2 dtopo file, which creates
$GTT/dtopo/dtopofiles/ASCE_SIFT_Region2.dtt3, an earthquake source. `
The hypothetical earthquake being modeled is one that was developed to mimic a “2500-year” event on a stretch of the Cascadia margin that includes Copalis Beach. We use it here because it is easy to generate the dtopofile using GeoClaw tools, as explained in the notebook linked above.
In Copalis Beach exercise1 some suggestions are given for downloading or creating other CSZ earthquake source models to test for comparison.
Why Copalis Beach?#
The region around Copalis Beach is shown in the Google Earth image below:
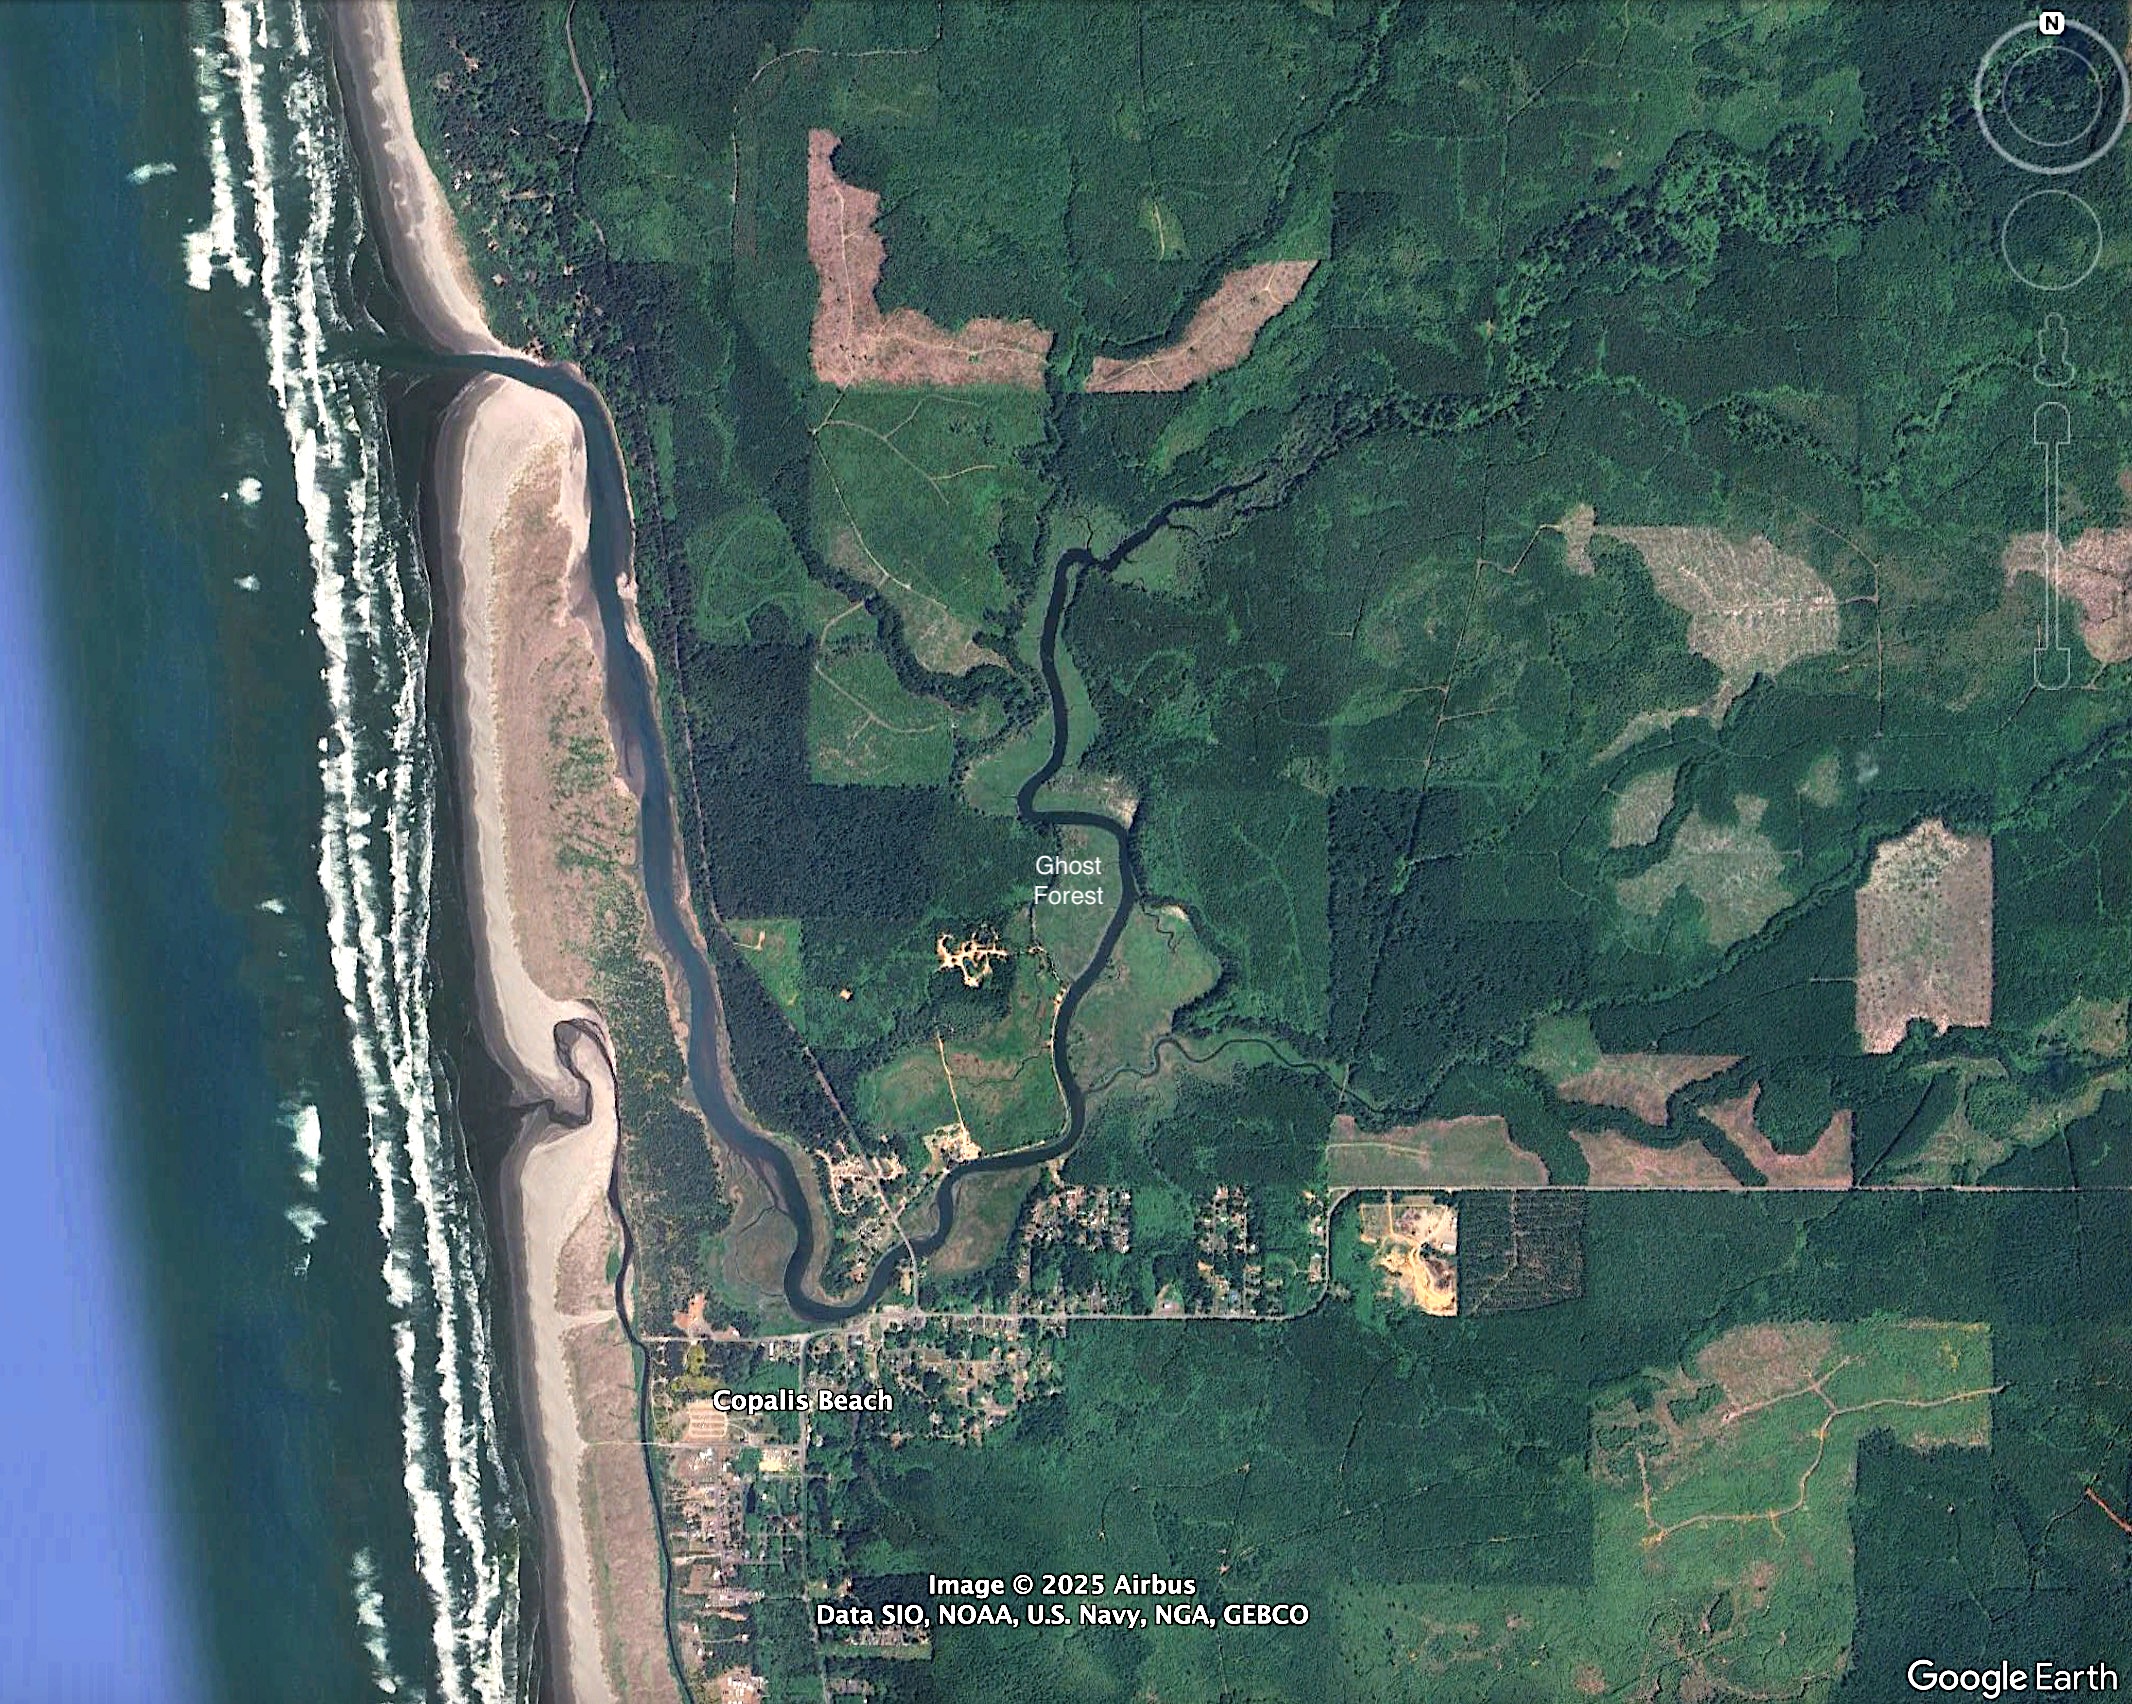
This region was chosen as a relatively small-scale example of interesting coastal topography. Moreover it is historically important in our understanding of past CSZ tsunamis. The ghost forest indicated in the satellite image above contains trees that were rapidly killed by saltwater intrusion following coseismic coastal subsidence during the earthquake of January 26, 1700, the last major CSZ event.
See also
For more information about this paleoseismology, see The Orphan Tsunami by Brian Atwater et al. [AMRS+05].